
Infographic visualization design
Infographic visualization design - GPT-Image2 industrial-grade reverse engineering prompt word template.
AI-generated demonstration · #001 · UI & UX Design · 16/9
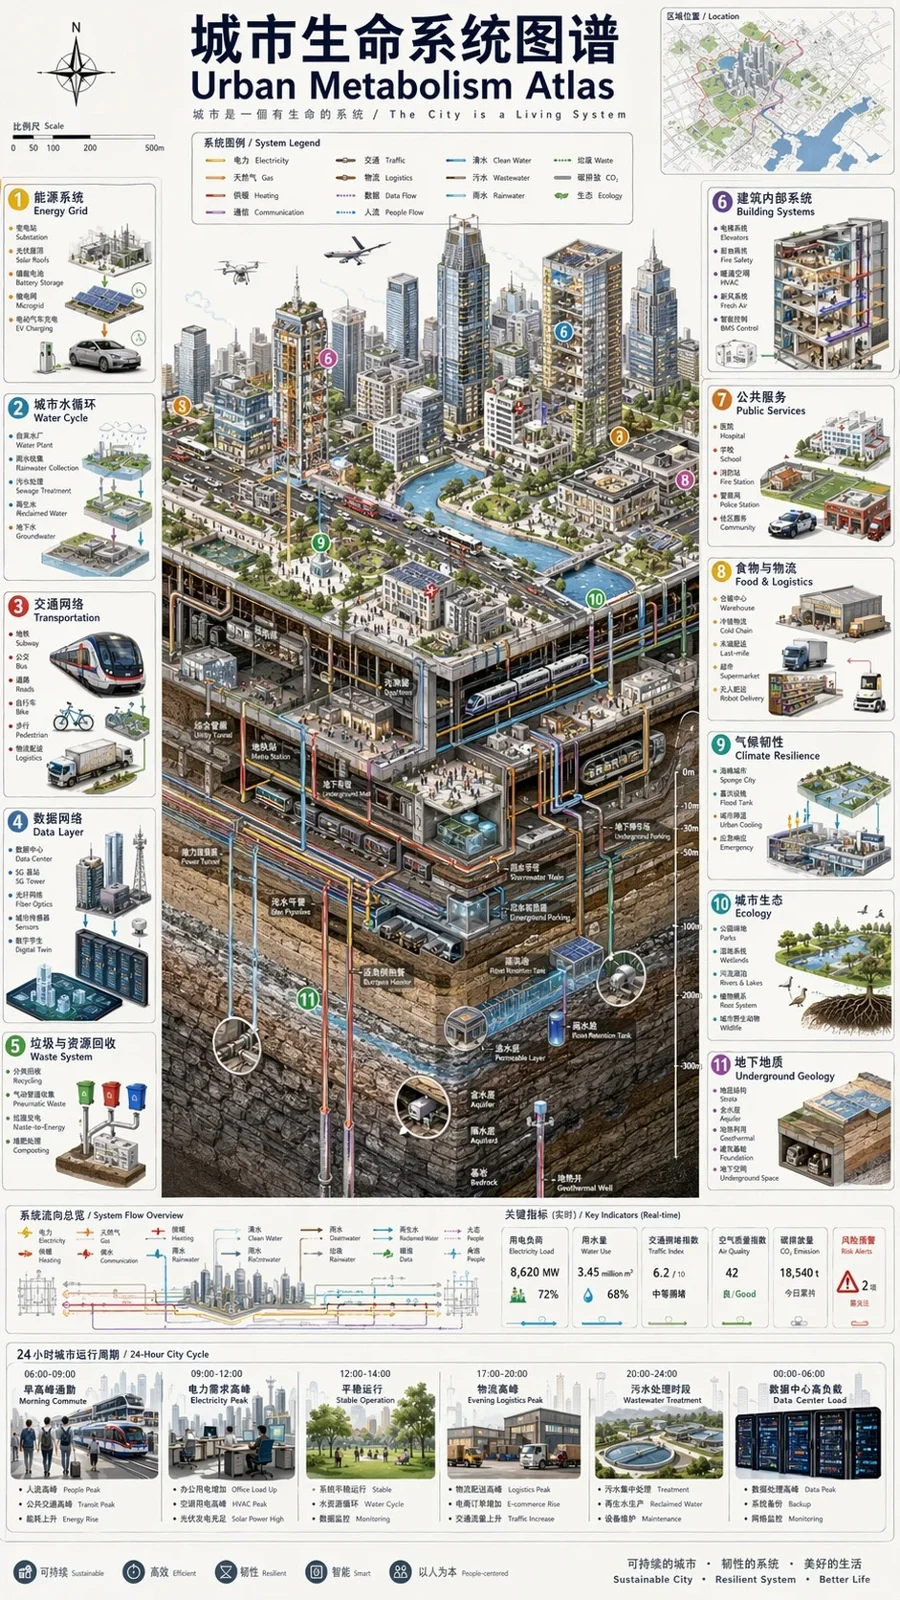
Prompt
Vertical 9:16 isometric cutaway infographic "城市生命系统图谱 / Urban Metabolism Atlas". Smart city from sky to bedrock: skyscrapers, streets, subway, utility tunnels, water/sewage/gas/heating pipes, fiber, data center, flood tanks, aquifers, geothermal wells, bedrock. Color-coded flows for power/water/data/traffic/waste. 12 numbered panels bilingual CN/EN: 能源/水循环/交通/数据/垃圾/建筑/公共服务/ 物流/气候韧性/生态/地质/治理看板. 24h timeline at bottom. Style: engineering white paper + scientific atlas, light paper bg, crisp lines, 8K. No cyberpunk, no gibberish text, must show both above AND below ground.
Style Breakdown
Use spacing, type scale, and a clear primary action to establish hierarchy. Keep labels short and use invented account names and neutral navigation.
Recommended Parameters / Aspect Ratio
Start with the template aspect ratio 16/9 to preserve the demonstrated framing. Use a standard preview resolution first, then increase output size after the composition works. Model-specific steps and guidance values are not supplied for this example; use your selected provider's defaults and adjust one setting at a time. Results vary between models.
Review Your Result
Review button alignment, text legibility, and repeated component spacing at full size. A generated interface is a visual concept, not working software.
Use Case Scenarios
Use this exercise for early wireframe discussions or visual direction boards. Rebuild the approved layout in accessible HTML before testing it with users.
Templates demonstrate visual techniques. They are not evidence of real events or endorsements. Use fictional subjects and authorized materials. Report concerns to [email protected].