
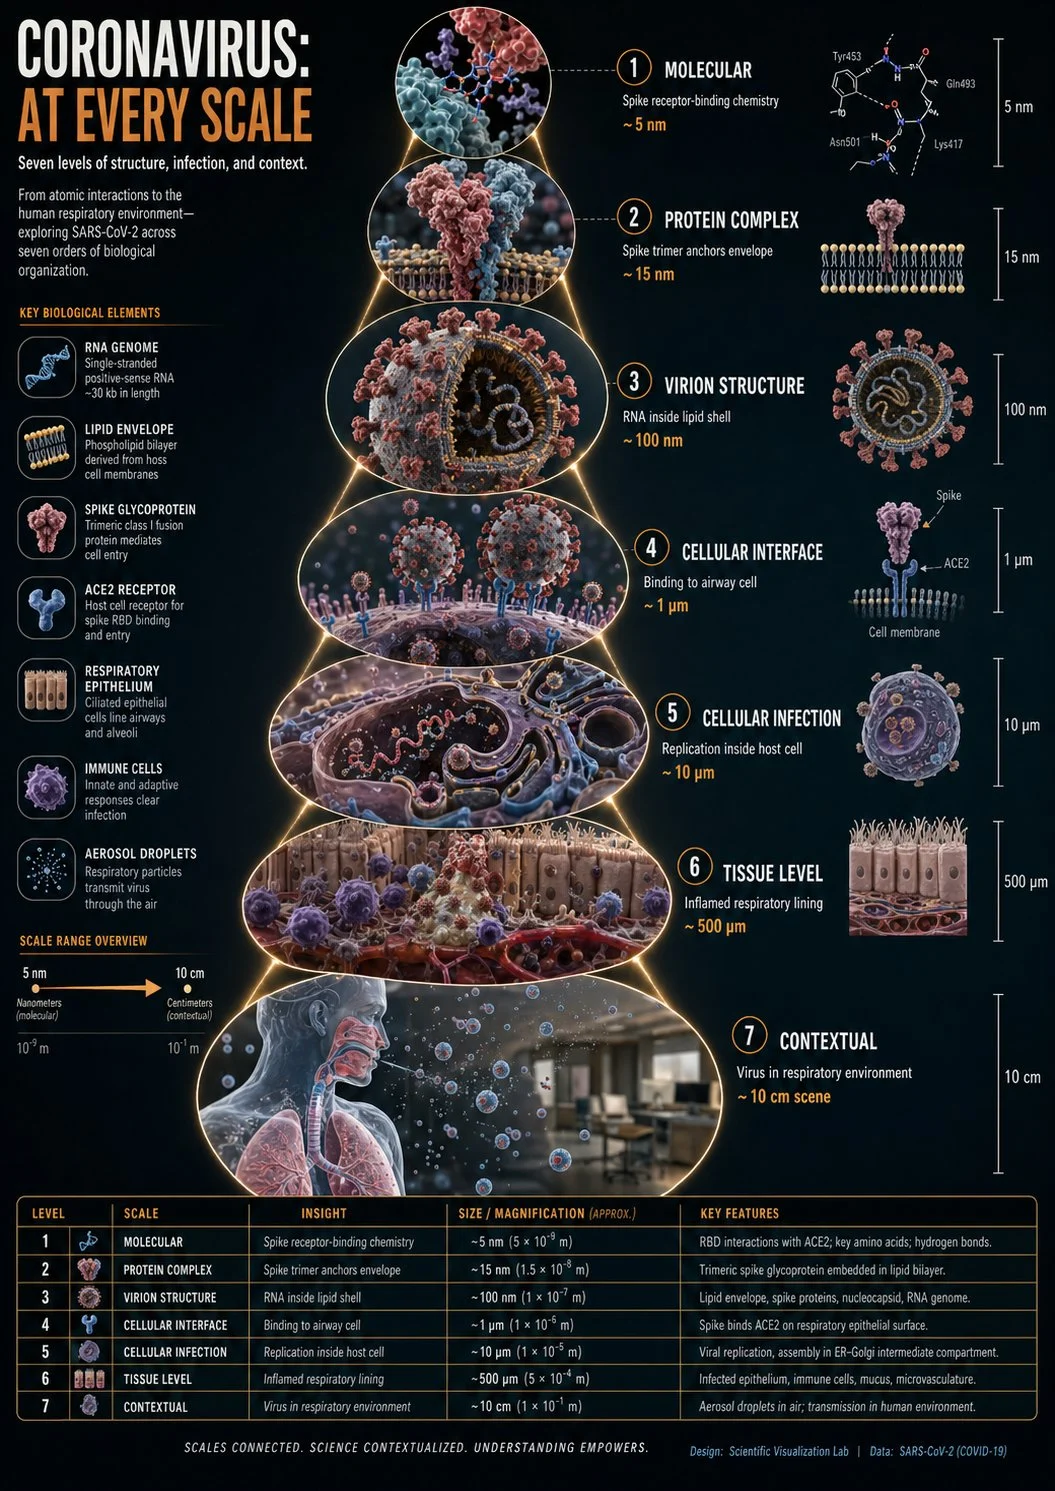
Coronavirus scale scaling science infographic
instructions> [SUBJECT]=Coronavirus. A hyper-realistic 3D zoom-sequence infographic generated from a single input: [SUBJECT]. The system auto-detects scale layers from atomic/subcomponent to full contextual view. Layout
AI-generated demonstration · #380 · Infographics & Cards · 16/9
Prompt
instructions> [SUBJECT]=Coronavirus. A hyper-realistic 3D zoom-sequence infographic generated from a single input: [SUBJECT]. The system auto-detects scale layers from atomic/subcomponent to full contextual view. Layout Structure (CRITICAL) 6–8 circular or hexagonal frames arranged in expanding sequence Innermost frame = smallest detectable detail; outermost = full subject in environment Frames connected by subtle zoom-path lines No repeated scales — each frame shows new level of detail Frame Design Each zoom level includes: Hyper-detailed 3D render at that scale Micro label: scale name (e.g., "molecular," "cellular," "structural") + 3–5 word insight Optional: measurement tag or magnification factor Contextual Halo Around the sequence, include only scale-specific references: Measurement units, scientific notation, cultural scale metaphors (No generic magnifying glass icons) Scale Panel (Alternative Layout) Zoom level Key insight (3–5 words) Scale factor tag Detail icon (grid, wave, particle, etc.) Title "[SUBJECT]: AT EVERY SCALE" (or) "ZOOM: THE WORLD OF [SUBJECT]" Style: ultra-realistic 3D render, scientific editorial infographic, precise macro lighting, global illumination, shallow depth of field, clean sequential layout. </instructions>
Style Breakdown
Organize the subject into a small number of labeled sections. Specify reading order, consistent icon treatment, and enough empty space between related facts.
Recommended Parameters / Aspect Ratio
Start with the template aspect ratio 16/9 to preserve the demonstrated framing. Use a standard preview resolution first, then increase output size after the composition works. Model-specific steps and guidance values are not supplied for this example; use your selected provider's defaults and adjust one setting at a time. Results vary between models.
Review Your Result
Treat every generated number, label, and diagram as a draft. Verify facts independently and rebuild important text as editable typography before publishing.
Use Case Scenarios
Use this method for learning cards, internal explainers, or an initial information architecture. Avoid using a generated chart as medical, engineering, or scientific evidence.
Templates demonstrate visual techniques. They are not evidence of real events or endorsements. Use fictional subjects and authorized materials. Report concerns to [email protected].